Network Documentation
Summary
This topic explain how network documentation is developed and used to troubleshoot network issues. Start learning CCNA 200-301 for free right now!!
Table of Contents
Documentation Overview
As with any complex activity like network troubleshooting, you will need to start with good documentation. Accurate and complete network documentation is required to effectively monitor and troubleshoot networks.
Common network documentation includes the following:
- Physical and logical network topology diagrams
- Network device documentation that records all pertinent device information
- Network performance baseline documentation
All network documentation should be kept in a single location, either as hard copy or on the network on a protected server. Backup documentation should be maintained and kept in a separate location.
Network Topology Diagrams
Network topology diagrams keep track of the location, function, and status of devices on the network. There are two types of network topology diagrams: the physical topology and the logical topology.
A physical network topology shows the physical layout of the devices connected to the network. You need to know how devices are physically connected to troubleshoot physical layer problems. Information recorded on the physical topology typically includes the following:
- Device name
- Device location (address, room number, rack location)
- Interface and ports used
- Cable type
The figure shows a sample physical network topology diagram.
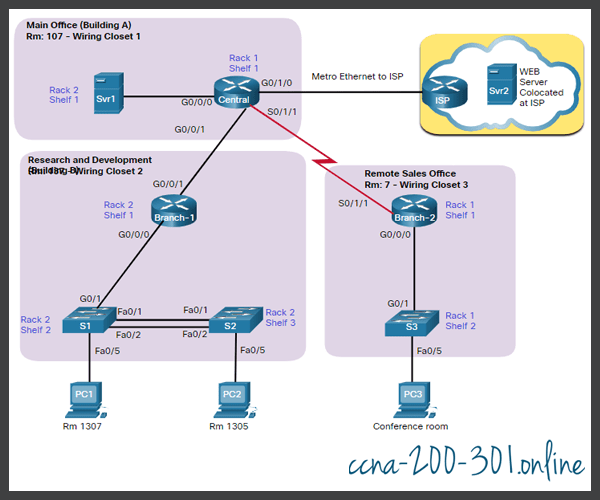
A logical network topology illustrates how devices are logically connected to the network. This refers to how devices transfer data across the network when communicating with other devices. Symbols are used to represent network components, such as routers, switches, servers, and hosts. Additionally, connections between multiple sites may be shown, but do not represent actual physical locations.
Information recorded on a logical network topology may include the following:
- Device identifiers
- IP addresses and prefix lengths
- Interface identifiers
- Routing protocols / static routes
- Layer 2 information (i.e., VLANs, trunks, EtherChannels)
The figure displays a sample logical IPv4 network topology.

Although IPv6 addresses could also be displayed in the same IPv4 logical topology, for the sake of clarity, we have created a separate logical IPv6 network topology.
The figure displays a sample IPv6 logical topology.

Network Device Documentation
Network device documentation should contain accurate, up-to-date records of the network hardware and software. Documentation should include all pertinent information about the network devices.
Many organizations create documents with tables or spreadsheets to capture relevant device information.
Establish a Network Baseline
The purpose of network monitoring is to watch network performance in comparison to a predetermined baseline. A baseline is used to establish normal network or system performance to determine the “personality” of a network under normal conditions.
Establishing a network performance baseline requires collecting performance data from the ports and devices that are essential to network operation.
A network baseline should answer the following questions:
- How does the network perform during a normal or average day?
- Where are the most errors occurring?
- What part of the network is most heavily used?
- What part of the network is least used?
- Which devices should be monitored and what alert thresholds should be set?
- Can the network meet the identified policies?
Measuring the initial performance and availability of critical network devices and links allows a network administrator to determine the difference between abnormal behavior and proper network performance, as the network grows, or traffic patterns change. The baseline also provides insight into whether the current network design can meet business requirements. Without a baseline, no standard exists to measure the optimum nature of network traffic and congestion levels.
Analysis after an initial baseline also tends to reveal hidden problems. The collected data shows the true nature of congestion or potential congestion in a network. It may also reveal areas in the network that are underutilized, and quite often can lead to network redesign efforts, based on quality and capacity observations.
The initial network performance baseline sets the stage for measuring the effects of network changes and subsequent troubleshooting efforts. Therefore, it is important to plan for it carefully.
Step 1 – Determine What Types of Data to Collect
When conducting the initial baseline, start by selecting a few variables that represent the defined policies. If too many data points are selected, the amount of data can be overwhelming, making analysis of the collected data difficult. Start out simply and fine-tune along the way. Some good starting variables are interface utilization and CPU utilization.
Step 2 – Identify Devices and Ports of Interest
Use the network topology to identify those devices and ports for which performance data should be measured. Devices and ports of interest include the following:
- Network device ports that connect to other network devices
- Servers
- Key users
- Anything else considered critical to operations
A logical network topology can be useful in identifying key devices and ports to monitor. In the figure, the network administrator has highlighted the devices and ports of interest to monitor during the baseline test.

The devices of interest include PC1 (the Admin terminal), and the two servers (i.e., Srv1 and Svr2). The ports of interest typically include router interfaces and key ports on switches.
By shortening the list of ports that are polled, the results are concise, and the network management load is minimized. Remember that an interface on a router or switch can be a virtual interface, such as a switch virtual interface (SVI).
Step 3 – Determine the Baseline Duration
The length of time and the baseline information being gathered must be long enough to determine a “normal” picture of the network. It is important that daily trends of network traffic are monitored. It is also important to monitor for trends that occur over a longer period, such as weekly or monthly. For this reason, when capturing data for analysis, the period specified should be, at a minimum, seven days long.
The figure displays examples of several screenshots of CPU utilization trends captured over a daily, weekly, monthly, and yearly period.

In this example, notice that the work week trends are too short to reveal the recurring utilization surge every weekend on Saturday evening, when a database backup operation consumes network bandwidth. This recurring pattern is revealed in the monthly trend. A yearly trend as shown in the example may be too long of a duration to provide meaningful baseline performance details. However, it may help identify long term patterns which should be analyzed further.
Typically, a baseline needs to last no more than six weeks, unless specific long-term trends need to be measured. Generally, a two-to-four-week baseline is adequate.
Baseline measurements should not be performed during times of unique traffic patterns, because the data would provide an inaccurate picture of normal network operations. Conduct an annual analysis of the entire network, or baseline different sections of the network on a rotating basis. Analysis must be conducted regularly to understand how the network is affected by growth and other changes.
Data Measurement
When documenting the network, it is often necessary to gather information directly from routers and switches. Obvious useful network documentation commands include ping, traceroute, and telnet, as well as show commands.
The table lists some of the most common Cisco IOS commands used for data collection.
| Command | Description |
|---|---|
show version | Displays uptime, version information for device software and hardware. |
show ip interface [brief] show ipv6 interface [brief] |
|
show interfaces |
|
show ip route show ipv6 route |
|
show cdp neighbors detail | Displays detailed information about directly connected Cisco neighbor devices. |
show arp show ipv6 neighbors | Displays the contents of the ARP table (IPv4) and the neighbor table (IPv6). |
show running-config | Displays current configuration. |
show vlan | Displays the status of VLANs on a switch. |
show port | Displays the status of ports on a switch. |
show tech-support |
|
Manual data collection using show commands on individual network devices is extremely time consuming and is not a scalable solution. Manual collection of data should be reserved for smaller networks or limited to mission-critical network devices. For simpler network designs, baseline tasks typically use a combination of manual data collection and simple network protocol inspectors.
Sophisticated network management software is typically used to baseline large and complex networks. These software packages enable administrators to automatically create and review reports, compare current performance levels with historical observations, automatically identify performance problems, and create alerts for applications that do not provide expected levels of service.
Establishing an initial baseline or conducting a performance-monitoring analysis may require many hours or days to accurately reflect network performance. Network management software or protocol inspectors and sniffers often run continuously over the course of the data collection process.
Ready to go! Keep visiting our networking course blog, give Like to our fanpage; and you will find more tools and concepts that will make you a networking professional.