Verify Connectivity
Summary
This topic use the output of the ping and tracert commands to verify connectivity and establish relative network performance. Start learning CCNA 200-301 for free right now!!
Table of Contents
Verify Connectivity with Ping
Whether your network is small and new, or you are scaling an existing network, you will always want to be able to verify that your components are properly connected to each other and to the internet. This topic discusses some utilities that you can use to ensure that your network is connected.
The ping command is the most effective way to quickly test Layer 3 connectivity between a source and destination IP address. The command also displays various round-trip time statistics.
Specifically, the ping command uses the Internet Control Message Protocol (ICMP) echo (ICMP Type 8) and echo reply (ICMP Type 0) messages. The ping command is available in most operating systems including Windows, Linux, macOS, and Cisco IOS.
On a Windows 10 host, the ping command sends four consecutive ICMP echo messages and expects four consecutive ICMP echo replies from the destination.
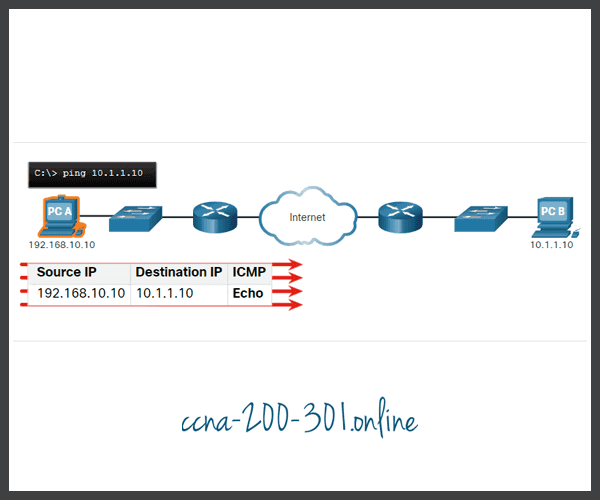
For example, assume PC A pings PC B. As shown in the figure, the PC A Windows host sends four consecutive ICMP echo messages to PC B (i.e., 10.1.1.10).

The destination host receives and processes the ICMP echos. As shown in the figure, PC B responds by sending four ICMP echo reply messages to PC A.

As shown in the command output, PC A has received echo replies from PC-B verifying the Layer 3 network connection.
C:\Users\PC-A> ping 10.1.1.10
Pinging 10.1.1.10 with 32 bytes of data:
Reply from 10.1.1.10: bytes=32 time=47ms TTL=51
Reply from 10.1.1.10: bytes=32 time=60ms TTL=51
Reply from 10.1.1.10: bytes=32 time=53ms TTL=51
Reply from 10.1.1.10: bytes=32 time=50ms TTL=51
Ping statistics for 10.1.1.10:
Packets: Sent = 4, Received = 4, Lost = 0 (0% loss),
Approximate round trip times in milli-seconds:
Minimum = 47ms, Maximum = 60ms, Average = 52ms
C:\Users\PC-A>
The output validates Layer 3 connectivity between PC A and PC B.
A Cisco IOS ping command output varies from a Windows host. For instance, the IOS ping sends five ICMP echo messages, as shown in the output.
R1# ping 10.1.1.10
Type escape sequence to abort.
Sending 5, 100-byte ICMP Echos to 10.1.1.10, timeout is 2 seconds:
!!!!!
Success rate is 100 percent (5/5), round-trip min/avg/max = 1/1/2 ms
R1#
Notice the !!!!! output characters. The IOS ping command displays an indicator for each ICMP echo reply received. The table lists the most common output characters from the ping command.
IOS Ping Indicators
| Element | Description |
|---|---|
| ! |
|
| . |
|
| U |
|
Extended Ping
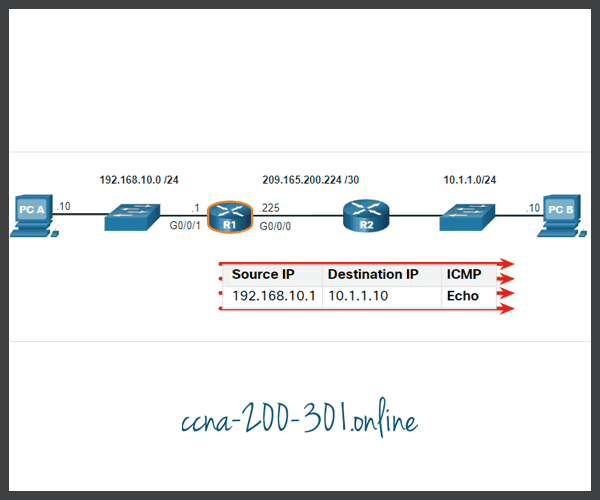
A standard ping uses the IP address of the interface closest to the destination network as the source of the ping. The source IP address of the ping 10.1.1.10 command on R1 would be that of the G0/0/0 interface (i.e., 209.165.200.225), as illustrated in the example.

The Cisco IOS offers an “extended” mode of the ping command. This mode enables the user to create special type of pings by adjusting parameters related to the command operation.
Extended ping is entered in privileged EXEC mode by typing ping without a destination IP address. You will then be given several prompts to customize the extended ping.
For example, assume you wanted to test connectivity from the R1 LAN (i.e., 192.168.10.0/24) to the 10.1.1.0 LAN. This could be verified from the PC A. However, an extended ping could be configured on R1 to specify a different source address.
As illustrated in the example, the source IP address of the extended ping command on R1 could be configured to use the G0/0/1 interface IP address (i.e., 192.168.10.1).

The following command output configures an extended ping on R1 and specifies the source IP address to be that of the G0/0/1 interface (i.e., 192.168.10.1).
R1# ping
Protocol [ip]:
Target IP address: 10.1.1.10
Repeat count [5]:
Datagram size [100]:
Timeout in seconds [2]:
Extended commands [n]: y
Ingress ping [n]:
Source address or interface: 192.168.10.1
DSCP Value [0]:
Type of service [0]:
Set DF bit in IP header? [no]:
Validate reply data? [no]:
Data pattern [0x0000ABCD]:
Loose, Strict, Record, Timestamp, Verbose[none]:
Sweep range of sizes [n]:
Type escape sequence to abort.
Sending 5, 100-byte ICMP Echos to 10.1.1.1, timeout is 2 seconds:
Packet sent with a source address of 192.168.10.1
!!!!!
Success rate is 100 percent (5/5), round-trip min/avg/max = 1/1/1 ms
R1#
Verify Connectivity with Traceroute
The ping command is useful to quickly determine if there is a Layer 3 connectivity problem. However, it does not identify where the problem is located along the path.
Traceroute can help locate Layer 3 problem areas in a network. A trace returns a list of hops as a packet is routed through a network. It could be used to identify the point along the path where the problem can be found.
The syntax of the trace command varies between operating systems, as illustrated in the figure.
Windows and Cisco IOS Trace Commands

The following is a sample output of tracert command on a Windows 10 host.
C:\Users\PC-A> tracert 10.1.1.10
Tracing route to 10.1.10 over a maximum of 30 hops:
1 2 ms 2 ms 2 ms 192.168.10.1
2 * * * Request timed out.
3 * * * Request timed out.
4 * * * Request timed out.
^C
C:\Users\PC-A>
The only successful response was from the gateway on R1. Trace requests to the next hop timed out as indicated by the asterisk (*), meaning that the next hop router did not respond. The timed out requests indicate that there is a failure in the internetwork beyond the LAN, or that these routers have been configured to not respond to echo requests used in the trace. In this example there appears to be a problem between R1 and R2.
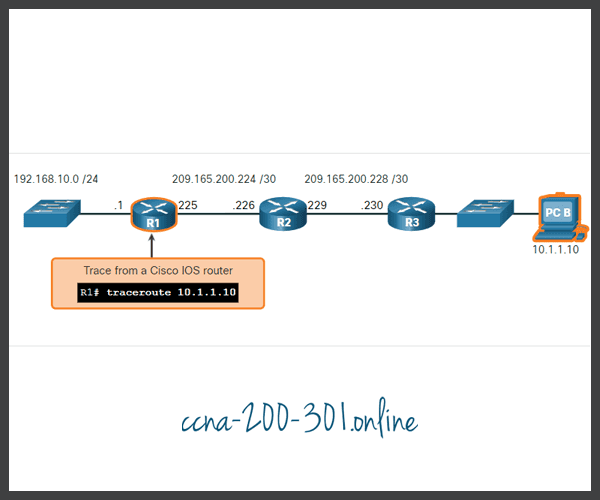
A Cisco IOS traceroute command output varies from the Windows tracert command. For instance, refer to the following topology.

The following is a sample output of traceroute command from R1.
R1# traceroute 10.1.1.10
Type escape sequence to abort.
Tracing the route to 10.1.1.10
VRF info: (vrf in name/id, vrf out name/id)
1 209.165.200.226 1 msec 0 msec 1 msec
2 209.165.200.230 1 msec 0 msec 1 msec
3 10.1.1.10 1 msec 0 msec
R1#
In this example, the trace validated that it could successfully reach PC B.
Timeouts indicate a potential problem. For instance, if the 10.1.1.10 host was not available, the traceroute command would display the following output.
R1# traceroute 10.1.1.10
Type escape sequence to abort.
Tracing the route to 10.1.1.10
VRF info: (vrf in name/id, vrf out name/id)
1 209.165.200.226 1 msec 0 msec 1 msec
2 209.165.200.230 1 msec 0 msec 1 msec
3 * * *
4 * * *
5 *
Use Ctrl-Shift-6 to interrupt a traceroute in Cisco IOS.
Extended Traceroute
Like the extended ping command, there is also an extended traceroute command. It allows the administrator to adjust parameters related to the command operation. This is helpful in locating the problem when troubleshooting routing loops, determining the exact next-hop router, or determining where packets are getting dropped or denied by a router or firewall.
The Windows tracert command allows the input of several parameters through options in the command line. However, it is not guided like the extended traceroute IOS command. The following output displays the available options for the Windows tracert command.
C:\Users\PC-A> tracert /?
Usage: tracert [-d] [-h maximum_hops] [-j host-list] [-w timeout]
[-R] [-S srcaddr] [-4] [-6] target_name
Options:
-d Do not resolve addresses to hostnames.
-h maximum_hops Maximum number of hops to search for target.
-j host-list Loose source route along host-list (IPv4-only).
-w timeout Wait timeout milliseconds for each reply.
-R Trace round-trip path (IPv6-only).
-S srcaddr Source address to use (IPv6-only).
-4 Force using IPv4.
-6 Force using IPv6.
C:\Users\PC-A>
The Cisco IOS extended traceroute option enables the user to create a special type of trace by adjusting parameters related to the command operation. Extended traceroute is entered in privileged EXEC mode by typing traceroute without a destination IP address. IOS will guide you through the command options by presenting a number of prompts related to the setting of all the different parameters.
For example, assume you want to test connectivity to PC B from the R1 LAN. Although this could be verified from PC A, an extended traceroute could be configured on R1 to specify a different source address.

As illustrated in the example, the source IP address of the extended traceroute command on R1 could be configured to use the R1 LAN interface IP address (i.e., 192.168.10.1).
R1# traceroute
Protocol [ip]:
Target IP address: 10.1.1.10
Ingress traceroute [n]:
Source address: 192.168.10.1
DSCP Value [0]:
Numeric display [n]:
Timeout in seconds [3]:
Probe count [3]:
Minimum Time to Live [1]:
Maximum Time to Live [30]:
Port Number [33434]:
Loose, Strict, Record, Timestamp, Verbose[none]:
Type escape sequence to abort.
Tracing the route to 192.168.10.10
VRF info: (vrf in name/id, vrf out name/id)
1 209.165.200.226 1 msec 1 msec 1 msec
2 209.165.200.230 0 msec 1 msec 0 msec
3 *
10.1.1.10 2 msec 2 msec
R1#
Network Baseline
One of the most effective tools for monitoring and troubleshooting network performance is to establish a network baseline. Creating an effective network performance baseline is accomplished over a period of time. Measuring performance at varying times and loads will assist in creating a better picture of overall network performance.
The output derived from network commands contributes data to the network baseline. One method for starting a baseline is to copy and paste the results from an executed ping, trace, or other relevant commands into a text file. These text files can be time stamped with the date and saved into an archive for later retrieval and comparison.
Among items to consider are error messages and the response times from host to host. If there is a considerable increase in response times, there may be a latency issue to address.
For example, the following ping output was captured and pasted into a text file.
August 19, 2021 at 08:14:43
C:\Users\PC-A> ping 10.1.1.10
Pinging 10.1.1.10 with 32 bytes of data:
Reply from 10.1.1.10: bytes=32 time<1ms TTL=64
Reply from 10.1.1.10: bytes=32 time<1ms TTL=64
Reply from 10.1.1.10: bytes=32 time<1ms TTL=64
Reply from 10.1.1.10: bytes=32 time<1ms TTL=64
Ping statistics for 10.1.1.10:
Packets: Sent = 4, Received = 4, Lost = 0 (0% loss),
Approximate round trip times in milli-seconds:
Minimum = 0ms, Maximum = 0ms, Average = 0ms
C:\Users\PC-A>
Notice the ping round-trip times are less than 1 ms.
A month later, the ping is repeated and captured.
September 19, 2021 at 10:18:21
C:\Users\PC-A> ping 10.1.1.10
Pinging 10.1.1.10 with 32 bytes of data:
Reply from 10.1.1.10: bytes=32 time=50ms TTL=64
Reply from 10.1.1.10: bytes=32 time=49ms TTL=64
Reply from 10.1.1.10: bytes=32 time=46ms TTL=64
Reply from 10.1.1.10: bytes=32 time=47ms TTL=64
Ping statistics for 10.1.1.10:
Packets: Sent = 4, Received = 4, Lost = 0 (0% loss),
Approximate round trip times in milli-seconds:
Minimum = 46ms, Maximum = 50ms, Average = 48ms
C:\Users\PC-A>
Notice this time that the ping round-trip times are much longer indicating a potential problem.
Corporate networks should have extensive baselines; more extensive than we can describe in this course. Professional-grade software tools are available for storing and maintaining baseline information. In this course, we cover a few basic techniques and discuss the purpose of baselines.
Cisco’s best practices for baseline processes can be found by searching the internet for “Baseline Process Best Practices”.
Lab – Test Network Latency with Ping and Traceroute
In this lab, you will complete the following objectives:
- Part 1: Use Ping to Document Network Latency
- Part 2: Use Traceroute to Document Network Latency
Ready to go! Keep visiting our networking course blog, give Like to our fanpage; and you will find more tools and concepts that will make you a networking professional.


